Liberty Hamilton
Side Projects
I'm very interested in visualization and analysis of all types of data, so I have included some interesting side projects here. Code is available on my github page -- see my code page for more information.
FEMA Analysis
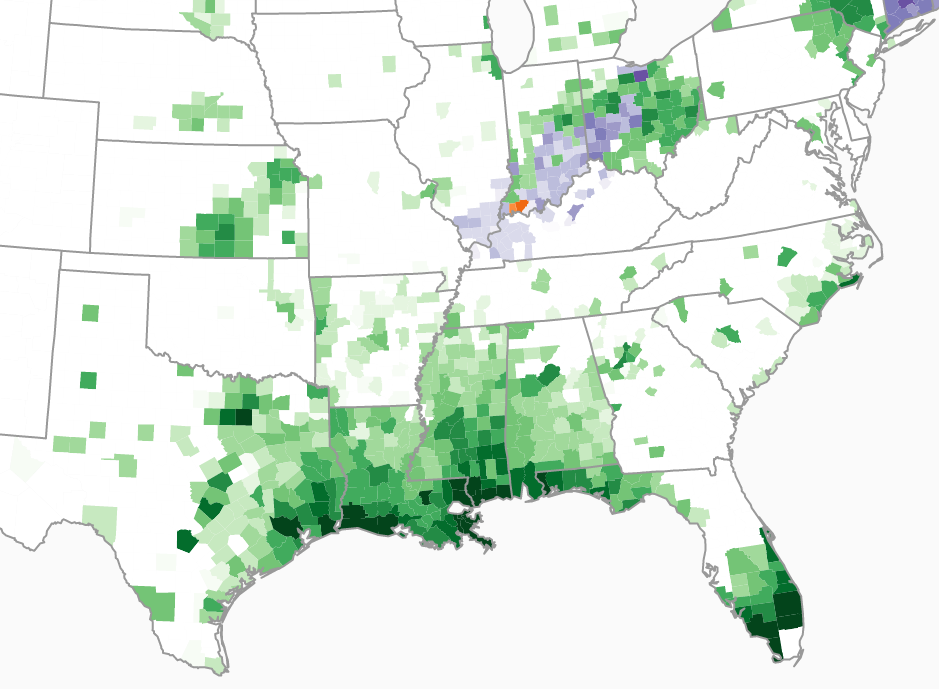
I used this project to learn d3, with the side effect being that I learned a lot about natural disasters in the U.S. Using free data from the government website http://www.data.gov, I chose to look at FEMA spending by U.S. county from 1999-2011.
Lab Safety
I made this visualization for an article written by graduate student Sam Sternberg in Issue 24 of the Berkeley Science Review. This is a simpler visualization written in d3, mostly from tutorials/examples by Mike Bostock.
A Time To Kilo
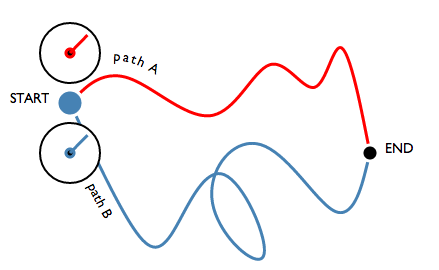
For Issue 25 of the Berkeley Science Review I created two visualizations describing the effort to redefine SI units in terms of fundamental constants for graduate student Anna Lieb's article A Time to Kilo. The first shows how quantum interference can be used to estimate the probability of the position of a particle. The second shows how this principle is used by Holger Müller's lab at Berkeley to determine the frequency of an oscillating Cesium atom, which can then be used to calculate its mass.
 Science |
 Code |